Showing posts with label commentary. Show all posts

Tuesday, March 6, 2012

Finally getting some movement

Well, i haven't posted for a while - as i was getting rather complacent with the market action.  Now that we have some selling, its time to start observing some action in stocks followed.  FCX is looking really good as of today.  Stopped out about a week ago, and decided to wait for a better setup.  Today provided such a setup.  Also took a nibble on CAT; even though i'm not totally sure its done selling, i'll manage the trade accordingly.  As for the broad market, it looks like we will have another day maybe two of selling before the buyers start piling in to stocks.  Many stocks are close to some pretty good support now, but another day will do wonders. Its hard to refrain from buying on the way down; especially when you are glued to the monitors throughout the day.  Usually when i think the market has sold enough, it needs another day.  On my radar this week are: NSC, PII, RGR, CAT, FCX, CLF, DE, EBAY, SLB, and CF.   I did manage to take a couple of VIX trades with profit to help out the downside the last couple days; however, i found the VIXX did not move like the VIX index, which was discouraging.  I'm not much on shorting stocks, but if they get over extended again (in certain ones) i will look at this option more closely.
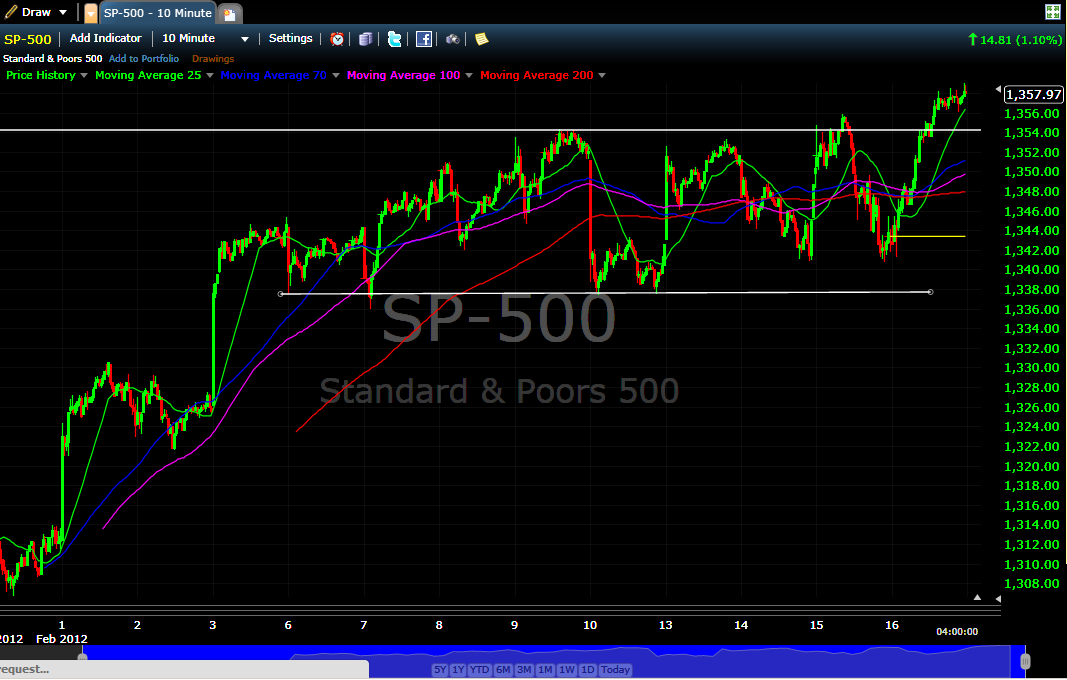
I'll end this post with a snapshot at some rough levels in the S&P to watch for support/resistance.

                                                                                             click chart to view

Monday, February 20, 2012

Gap up in futures

Monday night futures suggest a higher open tuesday in the market; depending on the Greek bailout of course.

Saturday, February 18, 2012

Long weekend

You know you are addicted to the stock market when you dread the market being closed for the weekend; especially a three day weekend.  To make matters worse, there aren't a whole lot of interesting charts out there - at least in terms of potential buy points.  As far as news, it seems the focus is on Whitney Houston, GOP candidates, and redundant statistics of how far the market has gone over X time periods.  When your'e plugged into the market full time you find it difficult to find news that gives you something with substance and benefit.  At this point it appears that the most bang for my buck is going to come from reading some earnings calls on select companies.  Some of the possible reads on earnings so far are: CLF, FCX, GOLD, DTV, DISCA, KSU, CF, and maybe MEAS.  If i were to go over the with a fine tooth comb, it would surely take me all weekend, but more likely i will skim the major stuff to determine if i should dig deeper.  Iv'e found the question and answer portion of the earnings call transcripts to be very important.  The analysts are paid well to understand the companies they follow and their questions will be worth noting; and the responses they get will often determine whether their will be major buying or selling of the stock.
Later this weekend i may go over some of the weekends more noteworthy reads.

Thursday, February 16, 2012

Strong market

There is some more bull left in the market, that's for sure.  We made a decent break of short term resistance and it  appears we are headed for the next resistance level; which should be at the 1370 level.  After that, we have the 1386 area, and then 1400!   There is some pretty smooth sailing in terms of resistance to those levels. We shall see though.  The European front had more of a hold on the market than many (including myself) believed.  It seemed like we could sell off yesterday and early today, but the positive economic data continues to bring support into the market.  Below is the 10 min. S&P 500 chart of the recent price action,  Beautiful high base technically speaking; and provides a decent amount of support in the short term if necessary.  With the run many stocks have had, its amazing we can continue to go higher, but the market is always right, and the technicals are supporting the move higher.
                                                                                           click chart to view

Monday, February 13, 2012

Monday recap

Well we ran up to the 1352.70 level right off this morning; then quickly retraced back to the 1346 and got some traction.  From there we spent the rest of the day grinding back to the 1352 level only to pull off that; finding a small test bounce right before the close at 1350.
It's a difficult time to look at any long positions at this time.  Obviously the risk/reward on quality stocks is not very attractive; at least from a technical perspective.  It's very likely we will continue to grind up into last year highs in the S&P - reflecting the stocks it represents and more.  With that said, i personally don't see a catylist strong enough to propel us beyond those levels at this time.  Unless we were to see some phenominal economic results to come out this week and beyond, or that combined with some miracle in Europe, it will be hard for investors to want to risk putting on large long positions.  I see many of the same scenarios playing out now that iv'e seen before in the market.  Cycles, the quality stocks get overbought, then the marginal companies start moving, then its the small caps that run, and the media starts interviewing investors who claim the market is going sky high.  You see bottom fishing going on in names that ordinarily wouldn't get a bid start taking off.  For crying out loud, then the shipping stocks start flying sky high.  Iv'e seen these patterns play out before.  I'm glad to see it because it gives me confidence in noticing patterns in market behavior.  I'm not saying we will sell hard at a specified time.  But i do know to be more nimble as we go forward; and manage my risk closer as well as lay off the trigger as we chew away at 52 week high levels in the market.
If we make a clean break above 1354 and close above that, i could see going higher yet; possibly hitting the 1370 level in short order.  That would put us at the top of last year's level in the market.  To speculate beyond that would require some more upside in the meanwhile.  I could throw up a bunch of charts tonight, but will keep it brief and refocus on the short term price action with the 10 min chart.  This shows how we are working through the recent levels pretty well.  You can see by today't action we recovered from friday's drop and ran back up in the form one could describe as an ascending wedge; which is a healthy approach to recent resistance.  I'll be watching to see if we can hold the 1350 level where we made a swing low prior to close and if we can handle some action in the 1352.70 and 1354 range.
                                                                                                   click chart to view

Sunday, February 12, 2012

Gap up ahead of monday

Its Sunday evening and the Greeks have passed the austerity vote and is positive in the futures trading at this time.  The gap up takes us above friday's trading range.  The chart shows friday's drop down in price action; and the highlighted circle shows where we will likely open up on monday.
                                                                                                      click chart to view
It will be important to watch the price action in the 1345 - 1355 area for signs of strength.  This would also be a likely area to see a rollover in the market.  Especially if we fail to get over the 1350 level.

Thursday, February 9, 2012

Time to chill out

Well i have put on some more long positions, but at these levels with current uncertainty, that is pushing the limit of sanity with just any stock.  ORLY just reported earnings yesterday; another great quarter.  With the exception of being a touch vague on comp store sales, all was great.  As for QCOM, well, gosh i couldn't resist.  I may pay for that.  The only other stocks that look good  (other than adding to some i already own), are CASY, FCFS and KOG.  Whether i add to any or enter one of the other three will have to be based on something other than what i am seeing in the market right this minute.  I'm not saying this run is over, not saying we are in for a fall, just saying i need to let things develop more one way or the other.  We are touching significant resistance levels in the S&P currently, and believing we don't stand the risk of reacting with a pullback of a percent or more would be reckless.  That being said, the market is showing rock star strength; hanging in there and showing that the trend is still to the upside.  Bottom line, i'm chilling out.

Tuesday, February 7, 2012

Two charts, two perspectives

The first chart is a 10 min. of the S&P; where the momentum is intact and behaving well.  The market is performing in an uptrend in spite of looming European debt problems.  The consolidation was very tight today, which one could assume has to do with the looming decision over the Greek bailout.  One could also make a case that the market is overbought at these levels and needs to pause or have a pullback, however, market sentiment is very strong right now and most money managers are expected to buy any sort of dips which may occur.
                                                                                                  click chart to view


This second chart is the S&P daily showing the main resistance levels overhead from 8-12 months ago.  You can see that price action has risen strongly and away from all the moving averages.  Also the stochastics and other indicators show an overbought scenario.  It is important to keep both a longer term perspective as well as a short term when observing the broad market and individual stocks.  At this point in the market many traders will tighten up their stops, sell partial positions or underperforming stocks into strength and/or wait for a correction for more opportunity.
             click chart to view

Monday, February 6, 2012

Healthy consolidation

We had what i would call a healthy pause in the market today.  So far the high base consolidation is proving the market has the potential for more upside.  According to my charts, after (or if) we make a clean break of the 1345 level, it looks like the 1355 level will likely be the next resistance level.   I also have noticed that there is a spike in the S&P futures this evening; not sure yet if there is progress on the Greek debt situation or something else.  We still have the whole EU situation looming as well as the potential for Iran to cause uncertainty in the market as well.  Keeping an eye on the short term downside levels, but also pulled the chart down a little to keep the upside 1355 in view.

                                                                                                      click chart to view


Sunday, February 5, 2012

S&P futures: scenario playing out so far.

One of the scenarios posted earlier is playing out so far (emphasize so far).  Would be nice to see some high base consolidation in the 1330-1345 range.  Another scenario to consider would be a one or two day falling wedge into the 1313- 1315 area, or a organized bull flag down to those levels over a few days time.   Barring anything market moving negative regarding the EU crisis - which could trump the short term technicals,  i'm increasingly bullish with each level of support from the 1313 area on up.

Saturday, February 4, 2012

Some short term downside levels


            click chart to view

Running of the Bulls

What a week it was!  There is no question the bulls are driving, the shorts are frying, and overall sentiment has become very positive.  This week saw manufacturing, confidence and employment data to back that up.  Can this trend continue?  One thing is for sure.  The market is always right.  Despite what we may ever think.  It is always best to make the observations and then lay out the possible scenarios.
Below is the S&P 500 daily chart.  We nailed the resistance level at 1345.  The major levels i marked are mostly to the upside (except two).  Not that the down side levels don't exist, but wanted to concentrate on the upside levels on this post.   I will post another chart showing downside support levels.

                                                                                          click chat to view


Thursday, February 2, 2012

Market acting well

Today we saw early resistance at the 1329 level followed by selling to 1322; which isn't bad for the market at these levels.  Looking at the last two days you can see the development of a high base which is actually somewhat organized.  Some more consolidation in this range would be bullish going forward.  If we make a higher low from yesterday's low at 1323 (marked on the chart), and continue working on some consolidation friday, then barring any bad news over the weekend could make the first of next week resolving this base and breaking out to some higher levels.  We may even see some movement at the higher range (1330) tomorrow.  With all that said, the market is always right.  It's always better to first make the observations, then look at the possible scenarios.
Happy trading everyone.  Take care.

                                                                                                 click chart to view


Wednesday, February 1, 2012

There was no question the bulls were in control today.  We ran up into the 1330 level and cleared several resistance levels by noon.  After lunch we began making lower highs after we lost the intraday support around 1327, ending the day catching support at 1323 and pulling up another point.
Instead of putting resistance lines all over the chart, i marked the 1333, 1330, and the 1325 levels; and left the circle to represent an "area" which no resolve has occured in my opinion.  It would not be surprising to see a backfill to the 1320 or even the 1313 level and still remain bullish.
With that said, it's not out of the question for a move higher and above 1320; albeit not as likely.  The chart   shows that there is a lot of different ways the market could play out within a range of 1300 to 1330; and still keep an upside bias.  Some consolidation in this range would be healthy for the market; and as we go forward the support / resistance levels will reveal themselves a little better.  Hope everyone had a great day.  Take care and happy trading.
                                                                                                  click chart to view


Tuesday, January 31, 2012

Market hanging in there

Well the market finished basically flat today.  At the open we shot up through the 1320 level in the S&P.  If you look at yesterday's chart of resistance levels, you will notice the 1320 level was a pretty strong move ahead of consumer confidence numbers (which brought us back lower).  We did however make a higher swing low from the previous day at the 1306 -1307 level; followed by an intraday higher swing low at 1308.63.  From there we spent the remainder of the day attacking the 1313 level of resistance in the form of a high base intraday.
We will see how this plays out tomorrow; barring any negative news from Europe we could continue upwards; possibly working back up towards the 1320 level.  Hope everyone had a super day.  Take care and see you tomorrow.
                                                                          click to view


Monday, January 30, 2012

Waiting, watching

Paying close attention to how the market behaves this week.  We are into some resistance not to be taken lightly; and observing how we either chew through these levels or pull off them is the key.  Below is the S&P 10 min. chart showing recent price action.  Iv'e littered this chart with support / resistance levels; which i expect the market to at least react to.  The key for me going forward is HOW the market reacts to these levels.  As you can see in today's price action, there was an orderly upward move into resistance which could be described as a bull flag.  From here, if we react to today's high by pulling back, which i have to consider that scenario, i will take a swing low that is higher than yesterday's low to be positive for a continuation to the upside.  Or, a move lower than yesterday's low to be a confirmation of a bear flag and a sign of downside search for a better support level.  On the first scenario of a higher swing low, from there i will be looking at how we attack yesterday's high, how we react to it, if we can make a higher swing low from the previous low, or move higher yet, and what kind of pattern may develop in the price action.
 I'm keeping it brief tonight, but will be doing post market commentaries on the technicals for the S&P most days.

                                                                                         CLICK CHART TO VIEW


Sunday, January 29, 2012

Hand off the trigger

Any long ideas got my plate empty at this time.  Of course one could go bottom fishing or looking at small cap / thinly traded stocks; hint (i'm seeing that in the market now) no thanks here.  As far as shorts go, my confidence there hasn't been confirmed with a valid break of our uptrend.  The vix is interesting now however, and shows some promise as soon as this week for a swing trade.  Patience is the key right now in the market.  There is nothing wrong with sitting on one's hands and see how things pan out.  I trimmed back on my longs, sitting 2/3 cash, and will be managing the remaining longs with caution.  In closing, here is the chart of the VIX showing where my target area in the 15.00 range makes sense.


Thursday, January 26, 2012

S&P: time to look at the weekly

We spit out a doji for the week (so far) on the S&P.  Reversal candles are worth paying attention to.     I'm just saying.                                                         click chart to view


support bounce likely

Falling wedge into this weeks high base is playing out as expected.  If we fall below 1306 things will change for the downside.

Wednesday, January 25, 2012

Sentiment over logic

Logic (and my resistance level previously posted) were tested today: but sentiment won over (Thank you Ben Bernanke).  Stocks are parked at or darn close to resistance not seen for some since last year at this time.  You know there are a lot of bag holders out there who have been waiting a long time to break even; so why not sell into those levels?  I might be sorry for it, but market sentiment is in the bull's court right now.  So, maybe the market needs some consolidation at these levels; maybe ratchet around plus or minus a half percent or so around the 1328 level in the S&P before going higher, or possibly continue grinding higher with some short covering along with the buyers fearing being left out of the upside.
We'll see.   But my hand is on the trigger.